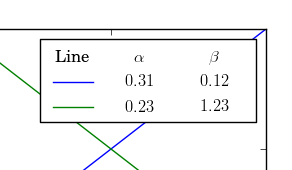
Legend in matplotlib is a collection of OffsetBox instances. And with some knowledge of offsetbox module, you can create a customized version of the legend, etc.
While the current offsetbox module does not have something like table, but one can emulate table by using the offsetboxes of fixed size.
import matplotlib.pyplot as plt
import matplotlib.offsetbox as moffsetbox
from matplotlib.text import Text
from matplotlib.lines import Line2D

ax = plt.subplot(111)
l1, = ax.plot([1,2,3])
l2, = ax.plot([1,3,2])

# below is code for legend-like box

headers = ["Line", r"$\alpha$", r"$\beta$"]
lines = [l1, l2]
label_1 = ["$0.31$", "$0.23$"]
label_2 = ["$0.12$", "$1.23$"]

###
fontsize = 12
height = fontsize


def get_hbox(widths):
    boxes = []
    for width in widths:
        xdescent, ydescent = width/2., fontsize*0.1
        c = moffsetbox.DrawingArea(width, height, xdescent, ydescent)
        boxes.append(c)
    hbox = moffsetbox.HPacker(pad=0, sep=0.5*fontsize, align="baseline",
                              children=boxes)
    return hbox

widths = [fontsize * 3, fontsize * 4, fontsize * 4]

# header

hb_header = get_hbox(widths)

for ob, s in zip(hb_header.get_children(), headers) :
    txt = Text(0, 0, s, ha="center", va="baseline",
               size=fontsize)
    ob.add_artist(txt)

# rows

def get_row(handle, label1, label2):
    hb_row0 = get_hbox(widths)
    hb_row = hb_row0.get_children()

    width = widths[0]
    l = Line2D([-width*0.4, width*0.4], [0.3*height, 0.3*height])
    l.update_from(handle)
    hb_row[0].add_artist(l)

    t = Text(0, 0, label1, ha="center", va="baseline")
    hb_row[1].add_artist(t)

    t = Text(0, 0, label2, ha="center", va="baseline")
    hb_row[2].add_artist(t)

    return hb_row0

rows = [get_row(handle, lab1, lab2) for handle, lab1, lab2 in zip(lines, label_1, label_2)]

vbox = moffsetbox.VPacker(pad=0, sep=0.5*fontsize, align="baseline",
                          children=[hb_header]+rows)

mybox = moffsetbox.AnchoredOffsetbox(loc=1, pad=0.4, borderpad=0.5,
                                     child=vbox, frameon=True,
                                     bbox_to_anchor=ax.bbox,
                                     bbox_transform=None,
                                     )


ax.add_artist(mybox)


plt.show()